By
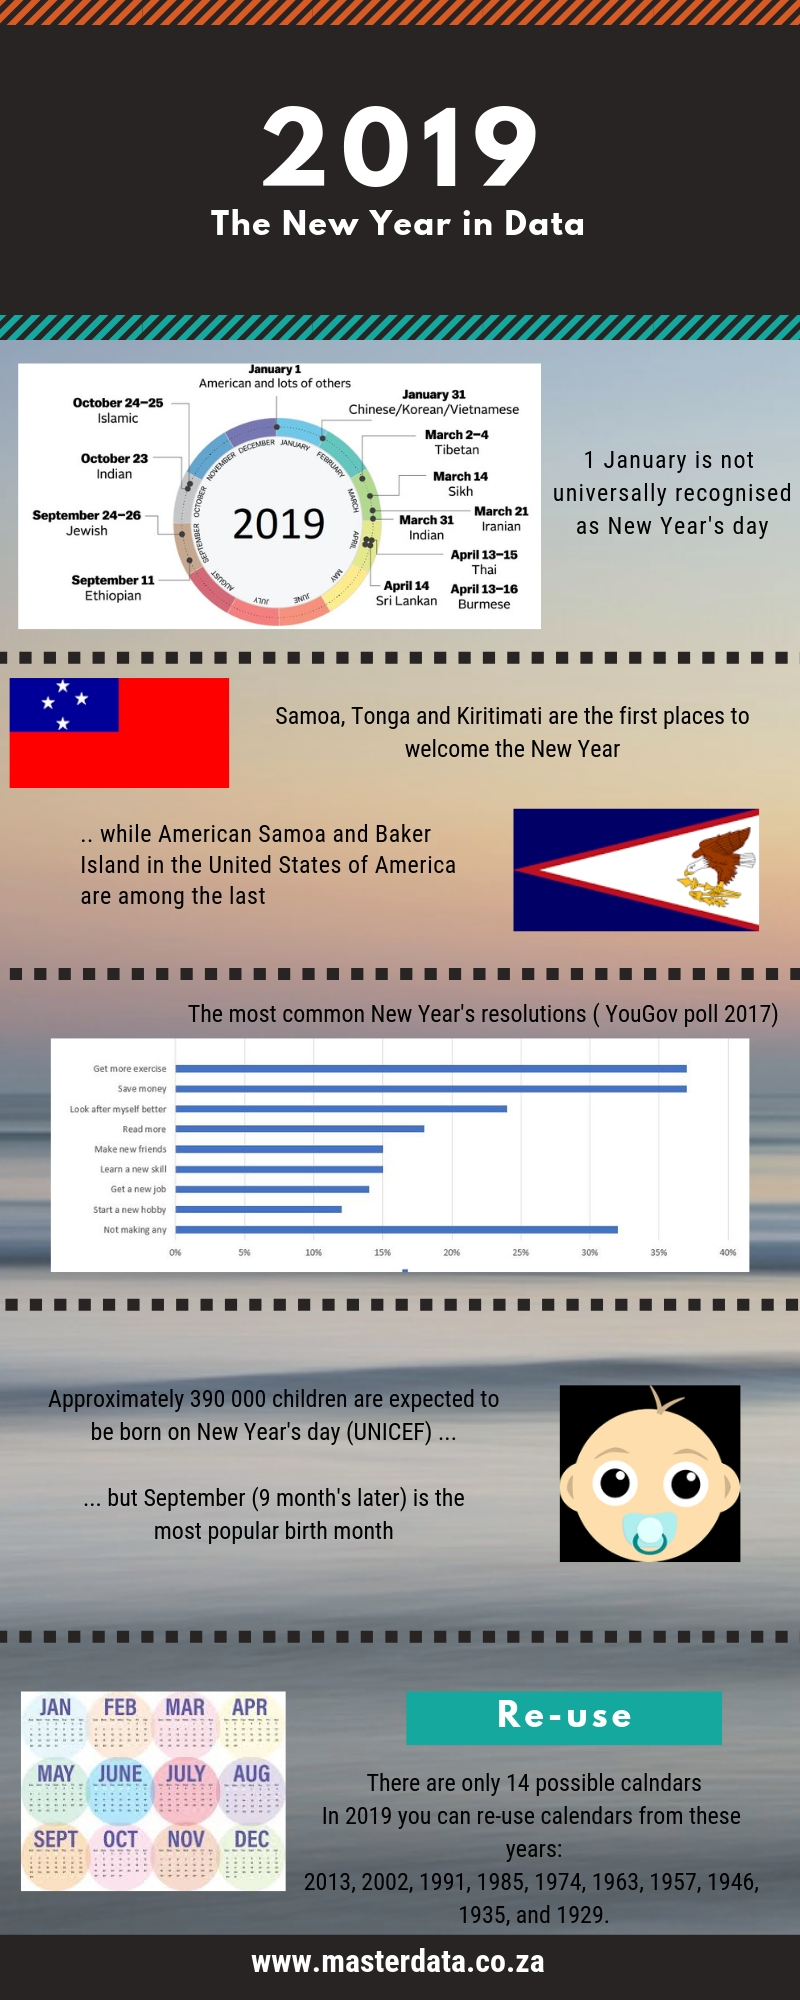
Our New Year infographic illustrates how one can use data visualisation to present details about the new year.
Tags:
Δ
This site uses Akismet to reduce spam. Learn how your comment data is processed.
Subscribe now to keep reading and get our new posts in your email.
Type your email…
Subscribe
Continue reading


Leave a comment