Home
Data Management
business case
CRM
customer experience
customer loyalty
data democratisation
data monetisation
digital transformation
IoT
marketing
chief data officer
data management trends
data strategy
data analytics
artificial intelligence
big data
big data challenges
big data technologies
data lake
business intelligence
DataOps
data science
decision-making
ethics
fake news
location intelligence
machine learning
self service BI
streaming analytics
visualisation and story-telling
data architecture
cloud
data catalog
data complexity
data management framework
data migration
data modelling
data security
mainframe
metadata management
business glossary
critical data elements
data lineage
role of information technology
data and compliance
AML
Consumer Protection Act
corporate governance
data privacy
popia
know your customer
FATCA
risk management
solvency and asset management
data culture
data governance
active data governance
data collection
data governance and mdm
data governance business case
data governance framework
data governance implementation
data governance roles
data governance structures
data governance tools
data stewardship
data integrity
data integration
data engineering
data preparation
ETL
data observability
data quality
1-10-100 rule
customer data quality
data cleansing
data profiling and discovery
data quality business case
data quality assessment
data quality implementation
data quality metrics
data quality remediation
data quality tools
data validation
geocoding
matching
trusted data
Master Data Management
mdm implementation
mdm tool selection
reference data management
single customer view
Data Literacy
GRC
About
About Gary Allemann
masterdata.co.za
Tag:
DataOps
DataOps
How Report Certification Strengthens DataOps: A Comprehensive Guide
DataOps
DataOps: From Data to Decision-Making
data analytics
The Data-Driven Enterprise of 2025 – How Close Are We?
data observability
Data Observability: A Game-Changer for Data-Driven Decision-Making
data quality
Data Quality Top Concern for Enterprises Seeking to Drive Business Agility in 2023
business intelligence
The Dangers of Flying Blind: The Importance of Accurate Data and Timely Reports in Running a Business
active data governance
Active Data Governance: The Backbone of Successful DataOps
DataOps
What is the Difference Between DevOps, DataOps, and MLOps?
self service BI
Self-service BI – more than just dashboards
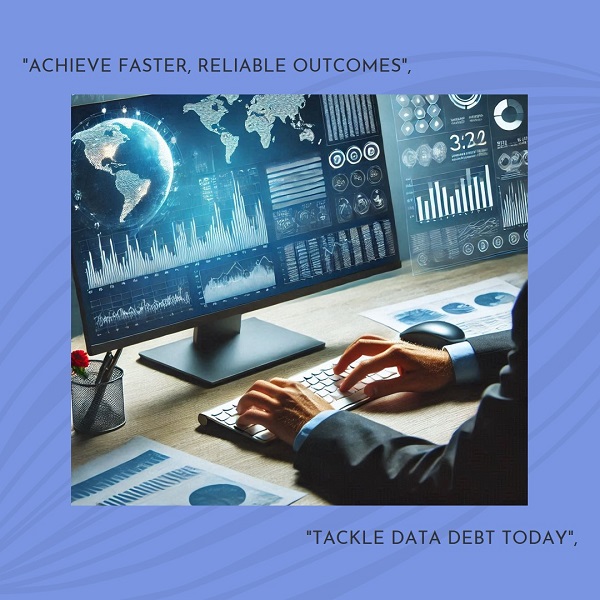
data analytics
Unlocking Efficiency in BI Reporting: Tackling Data Debt for Quicker, Trustworthy Results
Privacy & Cookies: This site uses cookies. By continuing to use this website, you agree to their use.
To find out more, including how to control cookies, see here:
Cookie Policy
Subscribe
Subscribed
Data Quality Matters
Join 294 other subscribers
Sign me up
Already have a WordPress.com account?
Log in now.
Data Quality Matters
Subscribe
Subscribed
Sign up
Log in
Report this content
View site in Reader
Manage subscriptions
Collapse this bar